House Example
This example populates houses, solar and storage onto an existing GridLAB-D feeder, using the write_node_houses and write_node_house_config functions from tesp_support. It does not run a transactive system.
To run the example:
./run.sh
#Use *ps* to learn when GridLAB-D finishes. It should take a couple of minutes.
python3 plots.py
File Directory
clean.sh: script that removes output and temporary files
gld_plots.png: results for the feeder, house load exceeds substation load because of solar generation
hvac_plots.png: results for the house air conditioning systems
meter_plots.png: results for the billing meters
plots.py: makes 3 pages of plots
README.rst: this file
run.sh: script that writes houses, creates a dictionary and runs GridLAB-D
test_houses.glm: GridLAB-D file that includes houses.glm and runs for two days
WriteHouses.py: writes houses on 14 primary nodes to houses.glm
Results
The example feeder has 14 primary nodes, populated as follows. 80% of the houses have air conditioning. Except where indicated, all are in region 2. All use a fixed seed for randomization and use a metrics collection interval of 300. See WriteHouses.py for details on how to set up the populations, and function documentation for other options.
Node |
Phasing |
kVA |
Drop[ft] |
Region |
Houses |
Other |
|---|---|---|---|---|---|---|
F7B1 |
ABC |
1000 |
0 |
2 |
42 |
|
F7B2 |
AS |
500 |
0 |
2 |
42 |
|
F7B3 |
BS |
500 |
0 |
2 |
42 |
|
F7B4 |
CS |
500 |
0 |
2 |
42 |
|
F7B5 |
AS |
500 |
75 |
2 |
42 |
triplex drop |
F7B6 |
BS |
500 |
75 |
2 |
42 |
triplex drop |
F7B7 |
CS |
500 |
75 |
2 |
42 |
solar and storage, triplex drop |
F7B8 |
ABC |
1000 |
0 |
2 |
40 |
uses loadkw and house_avg_kw |
F1B1 |
ABC |
1000 |
0 |
1 |
42 |
|
F1B2 |
ABC |
1000 |
0 |
3 |
42 |
|
F1B3 |
ABC |
1000 |
0 |
4 |
42 |
|
F1B4 |
ABC |
1000 |
0 |
5 |
42 |
|
F1B5 |
ABC |
1000 |
75 |
2 |
42 |
quadriplex service drop |
F1B6 |
ABC |
1000 |
0 |
2 |
42 |
solar and storage |
Plotted results from this example.
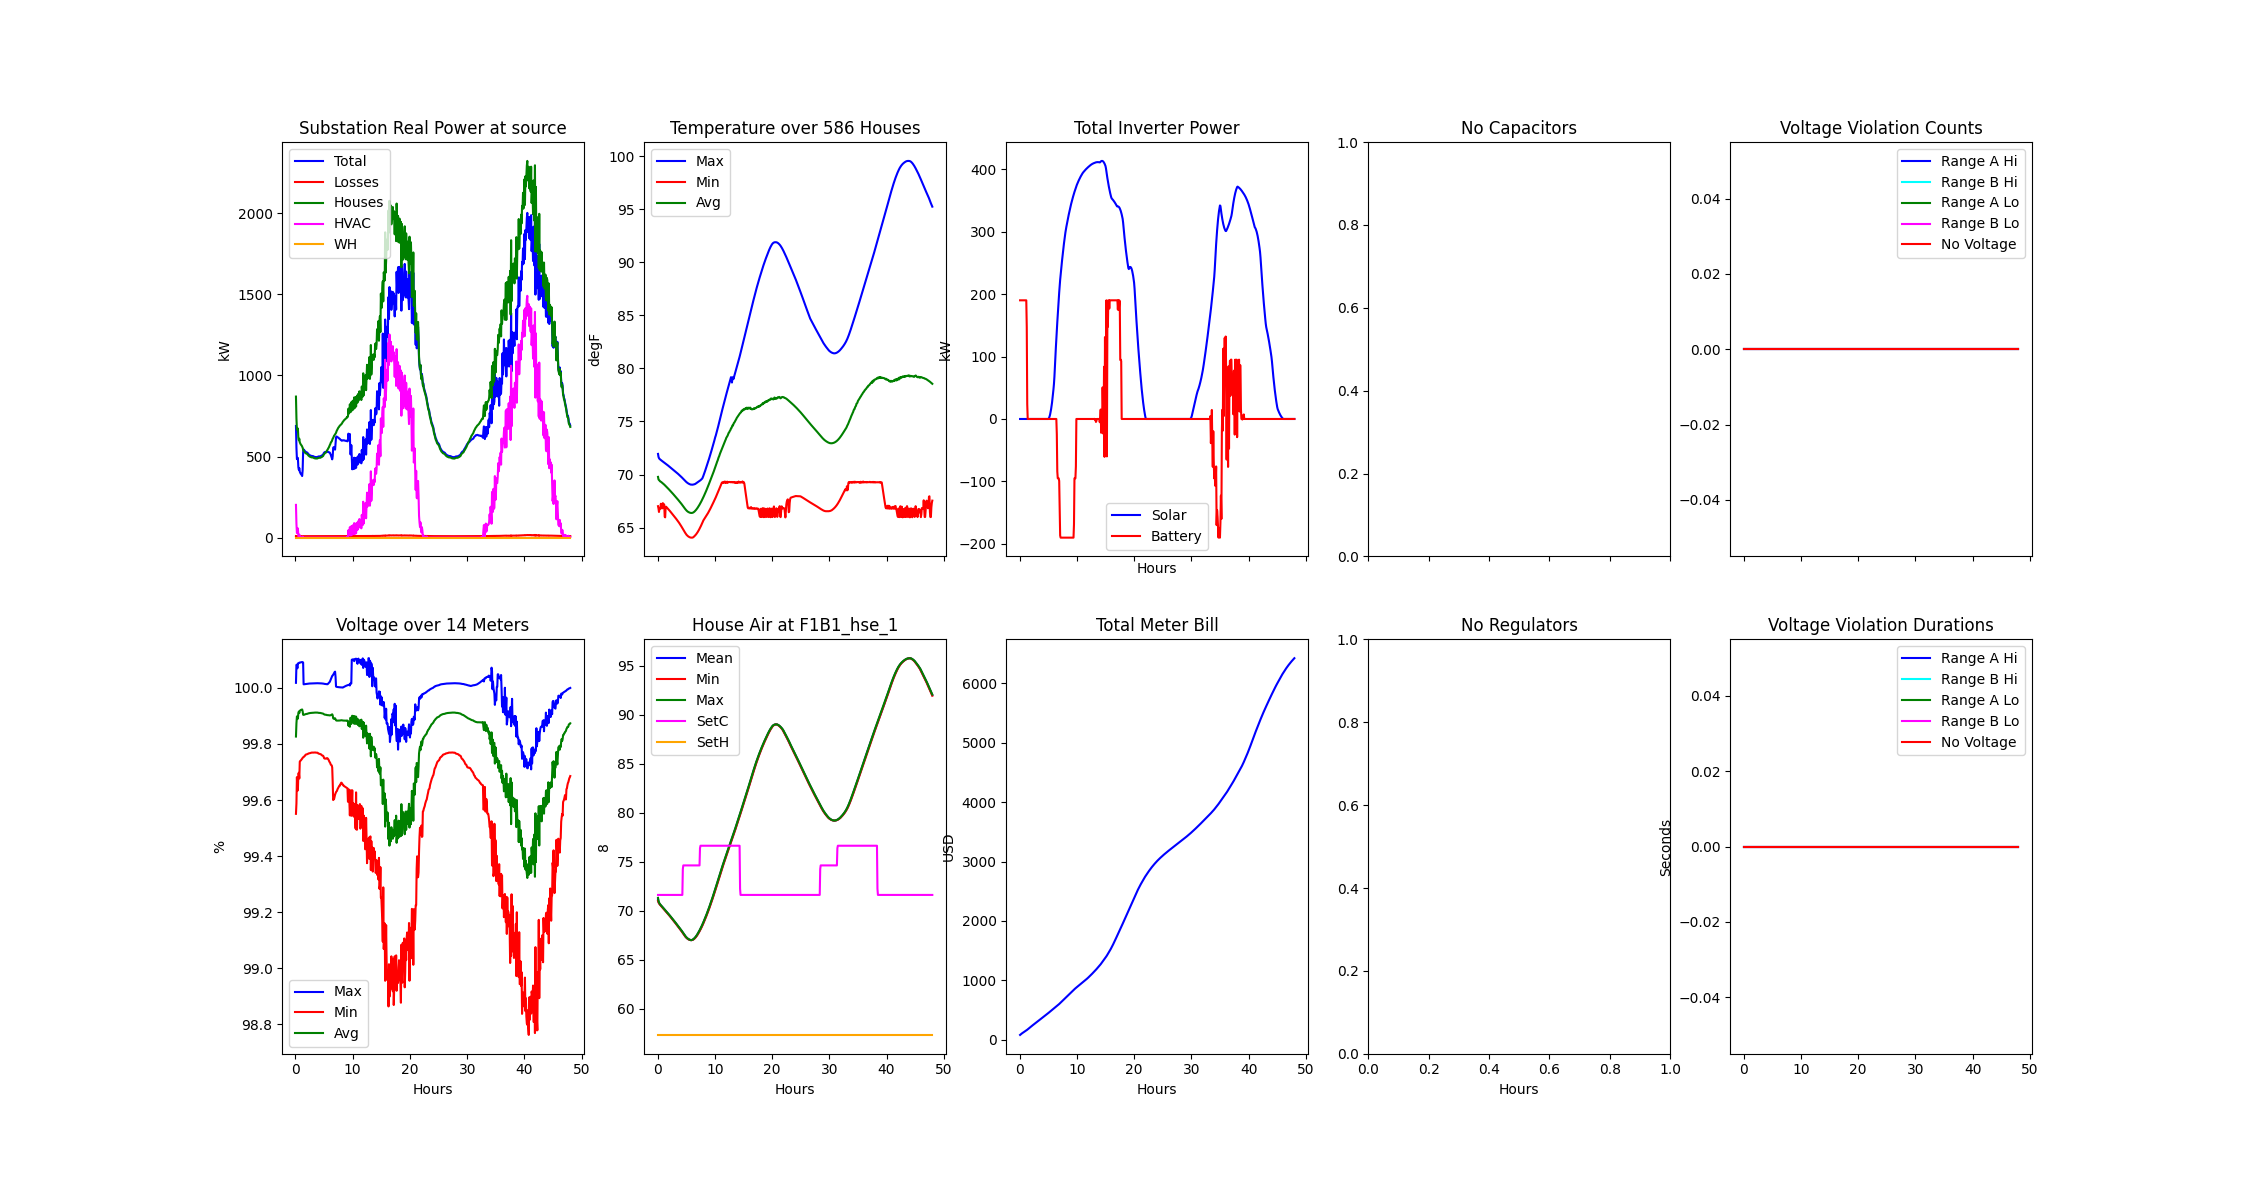
Fig. 5 Results collected from GridLAB-D measurements
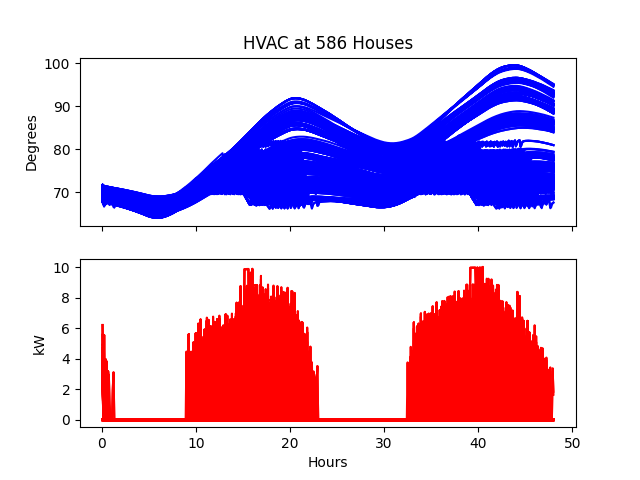
Fig. 6 Operation of all HVACs in GridLAB-D
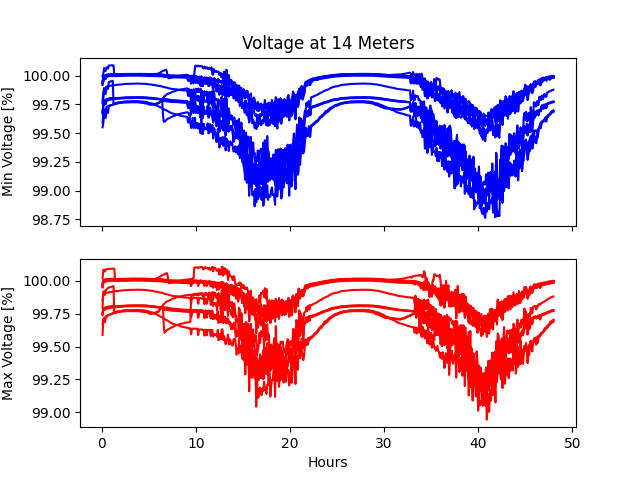
Fig. 7 Meter measurements of all houses in GridLAB-D
Copyright (c) 2017-2025 Battelle Memorial Institute